Changelog

Product updates.

What's new in Sola.

When your infrastructure has a bad moment, Sola no longer floods your team with one alert per failing endpoint. Smart Alert Grouping clusters related failures into a single incident so you see the full picture immediately.

Added

  • Automatic grouping of related endpoint failures into single incidents

  • Configurable grouping rules by endpoint group, region, or tag

  • Root cause suggestion based on failure patterns across grouped alerts

  • Grouping history included in postmortem reports

Improved

  • Group-level timeline shows which endpoints failed and in what order

  • Notification volume reduced by up to 80% during cascading failures

  • Incident page now surfaces the most likely root cause at the top

Fixed

  • Rare case where a single endpoint failure was grouped with an unrelated incident

  • Ungroup action not persisting correctly after page refresh
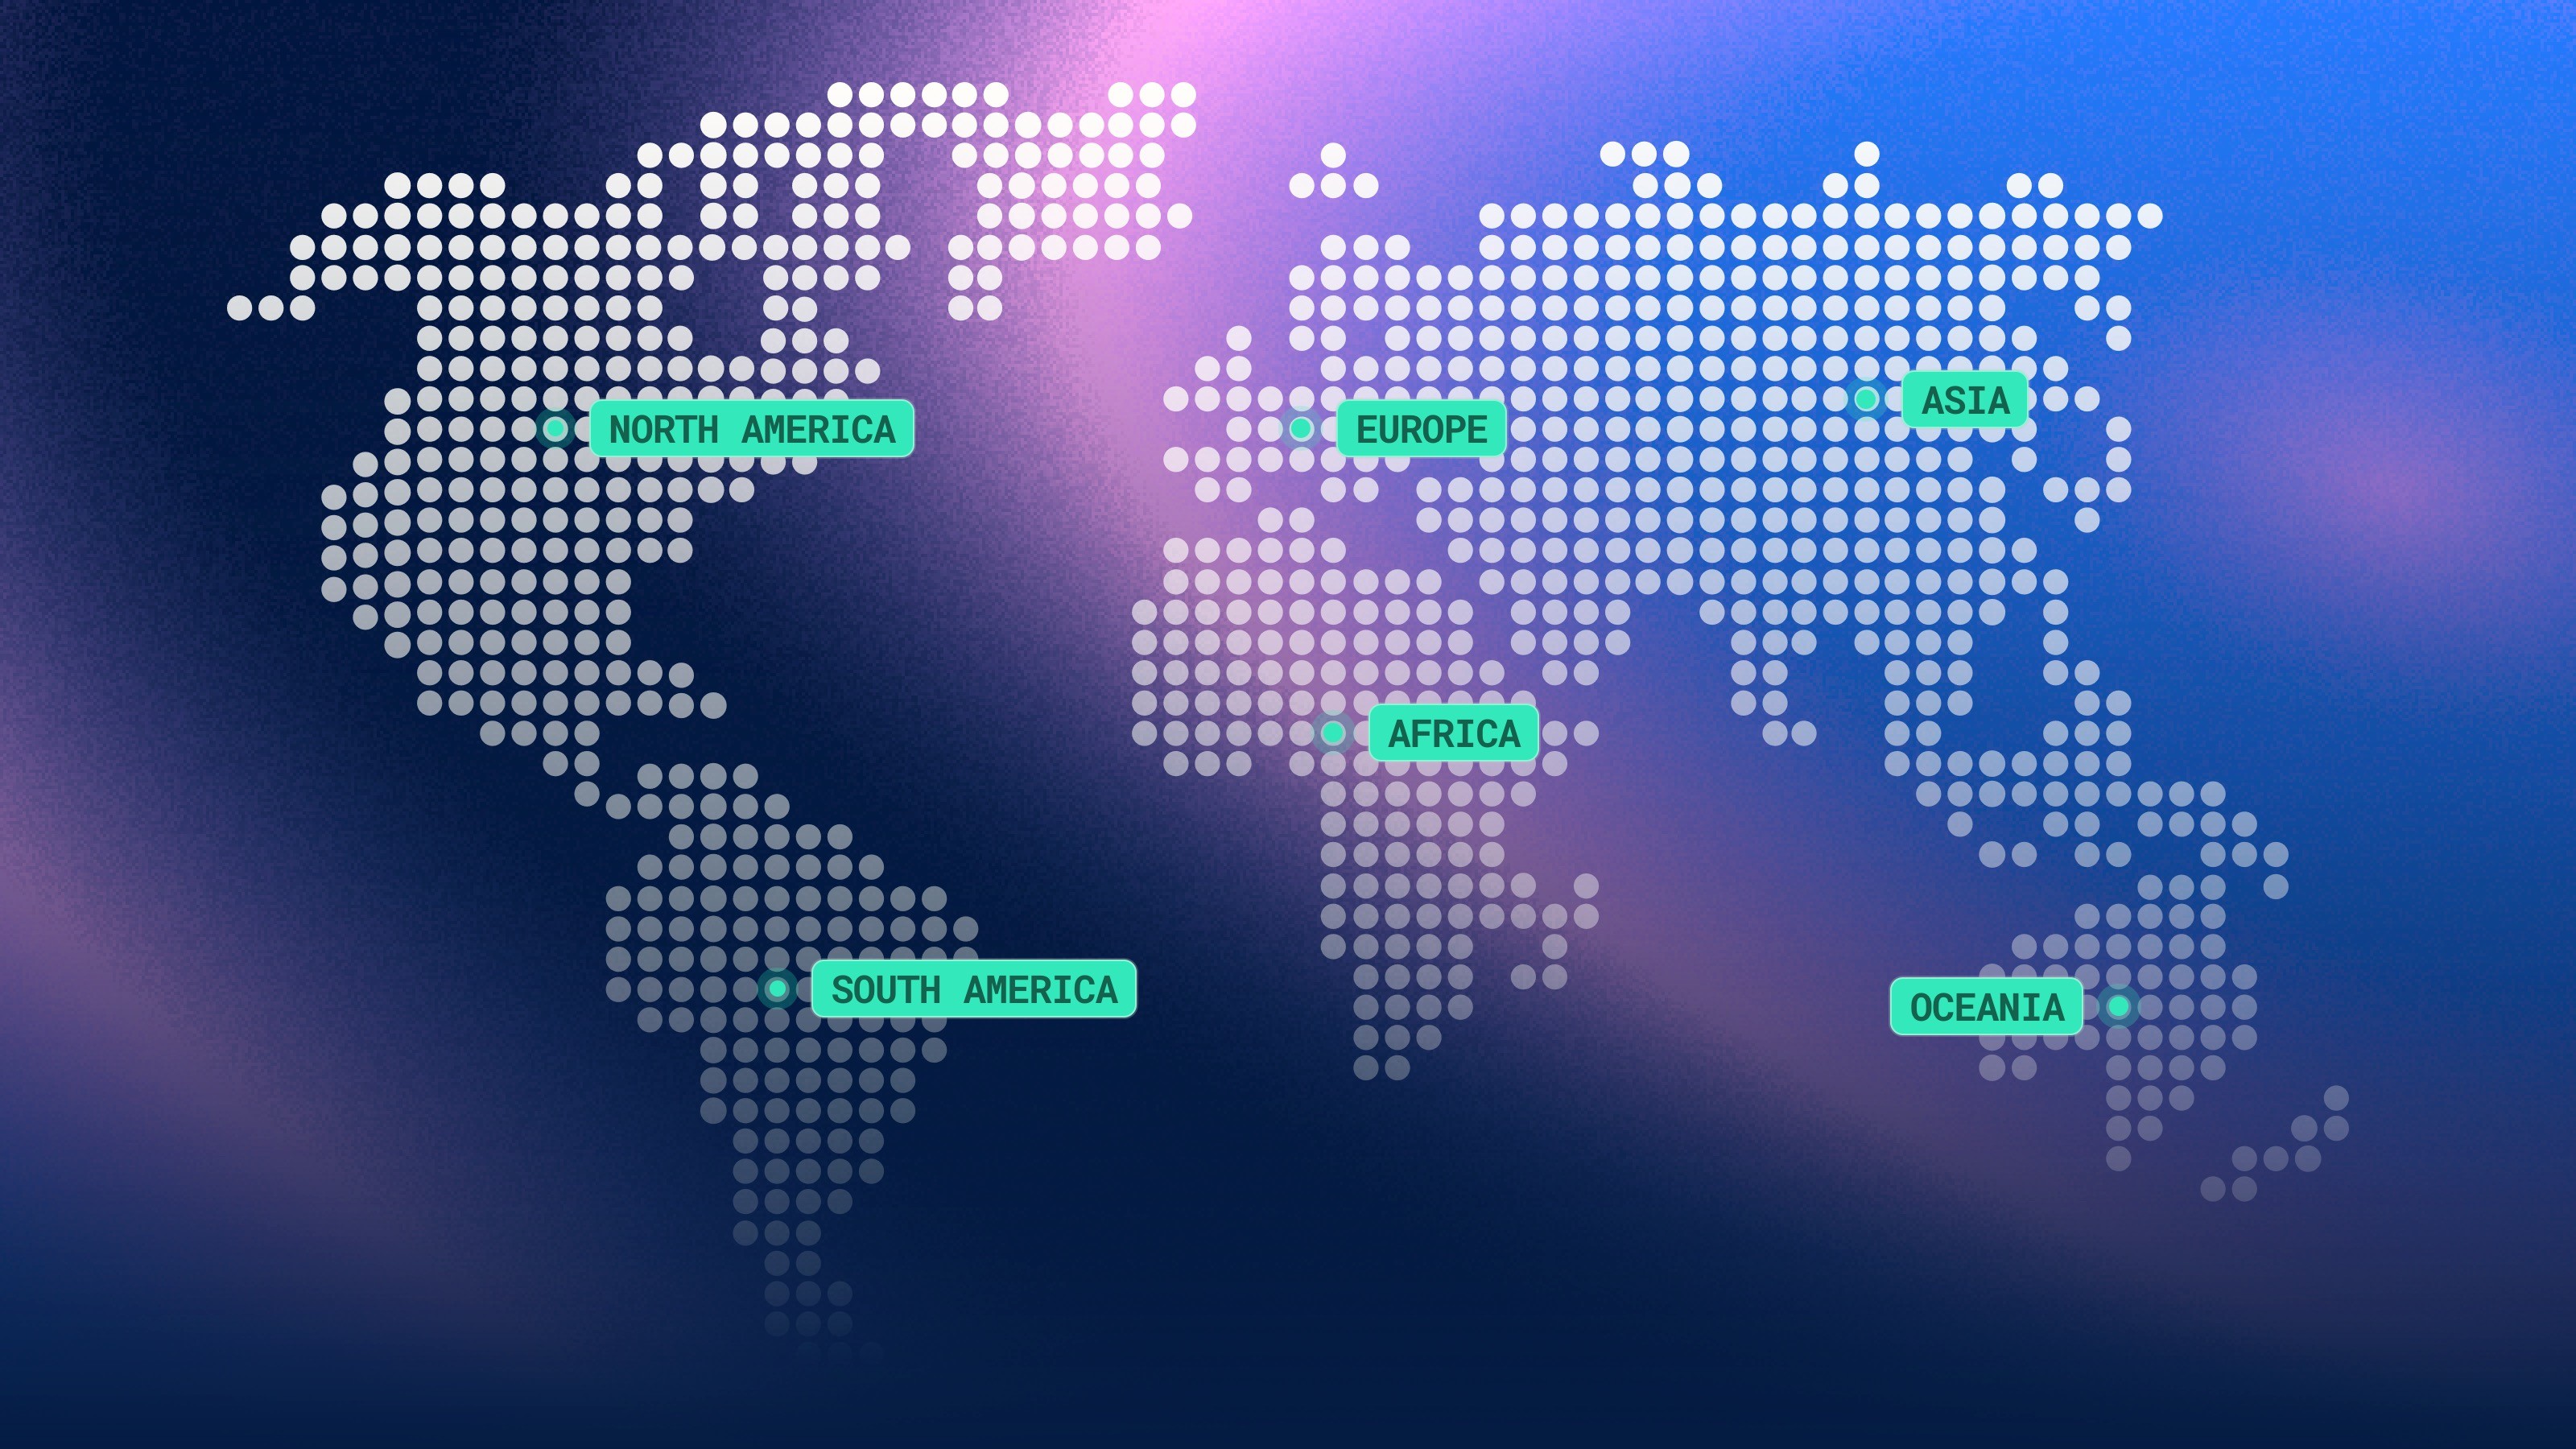
We've expanded our global monitoring network from 12 to 18 regions, giving you broader coverage and more accurate consensus-based alerting across every continent.

Added

  • 6 new monitoring regions: Brazil, Chile, UAE, South Africa, Sweden, and Mexico

  • Per-region latency history visible in the monitoring dashboard

  • Partial outage detection with automatic region isolation

  • N+2 redundancy across all 18 nodes

  • Configurable majority-rules alerting threshold per endpoint

Improved

  • Regional breakdown now included in every alert notification

  • Consensus algorithm updated to weight checks by region proximity

  • Dashboard map view updated to reflect all new node locations

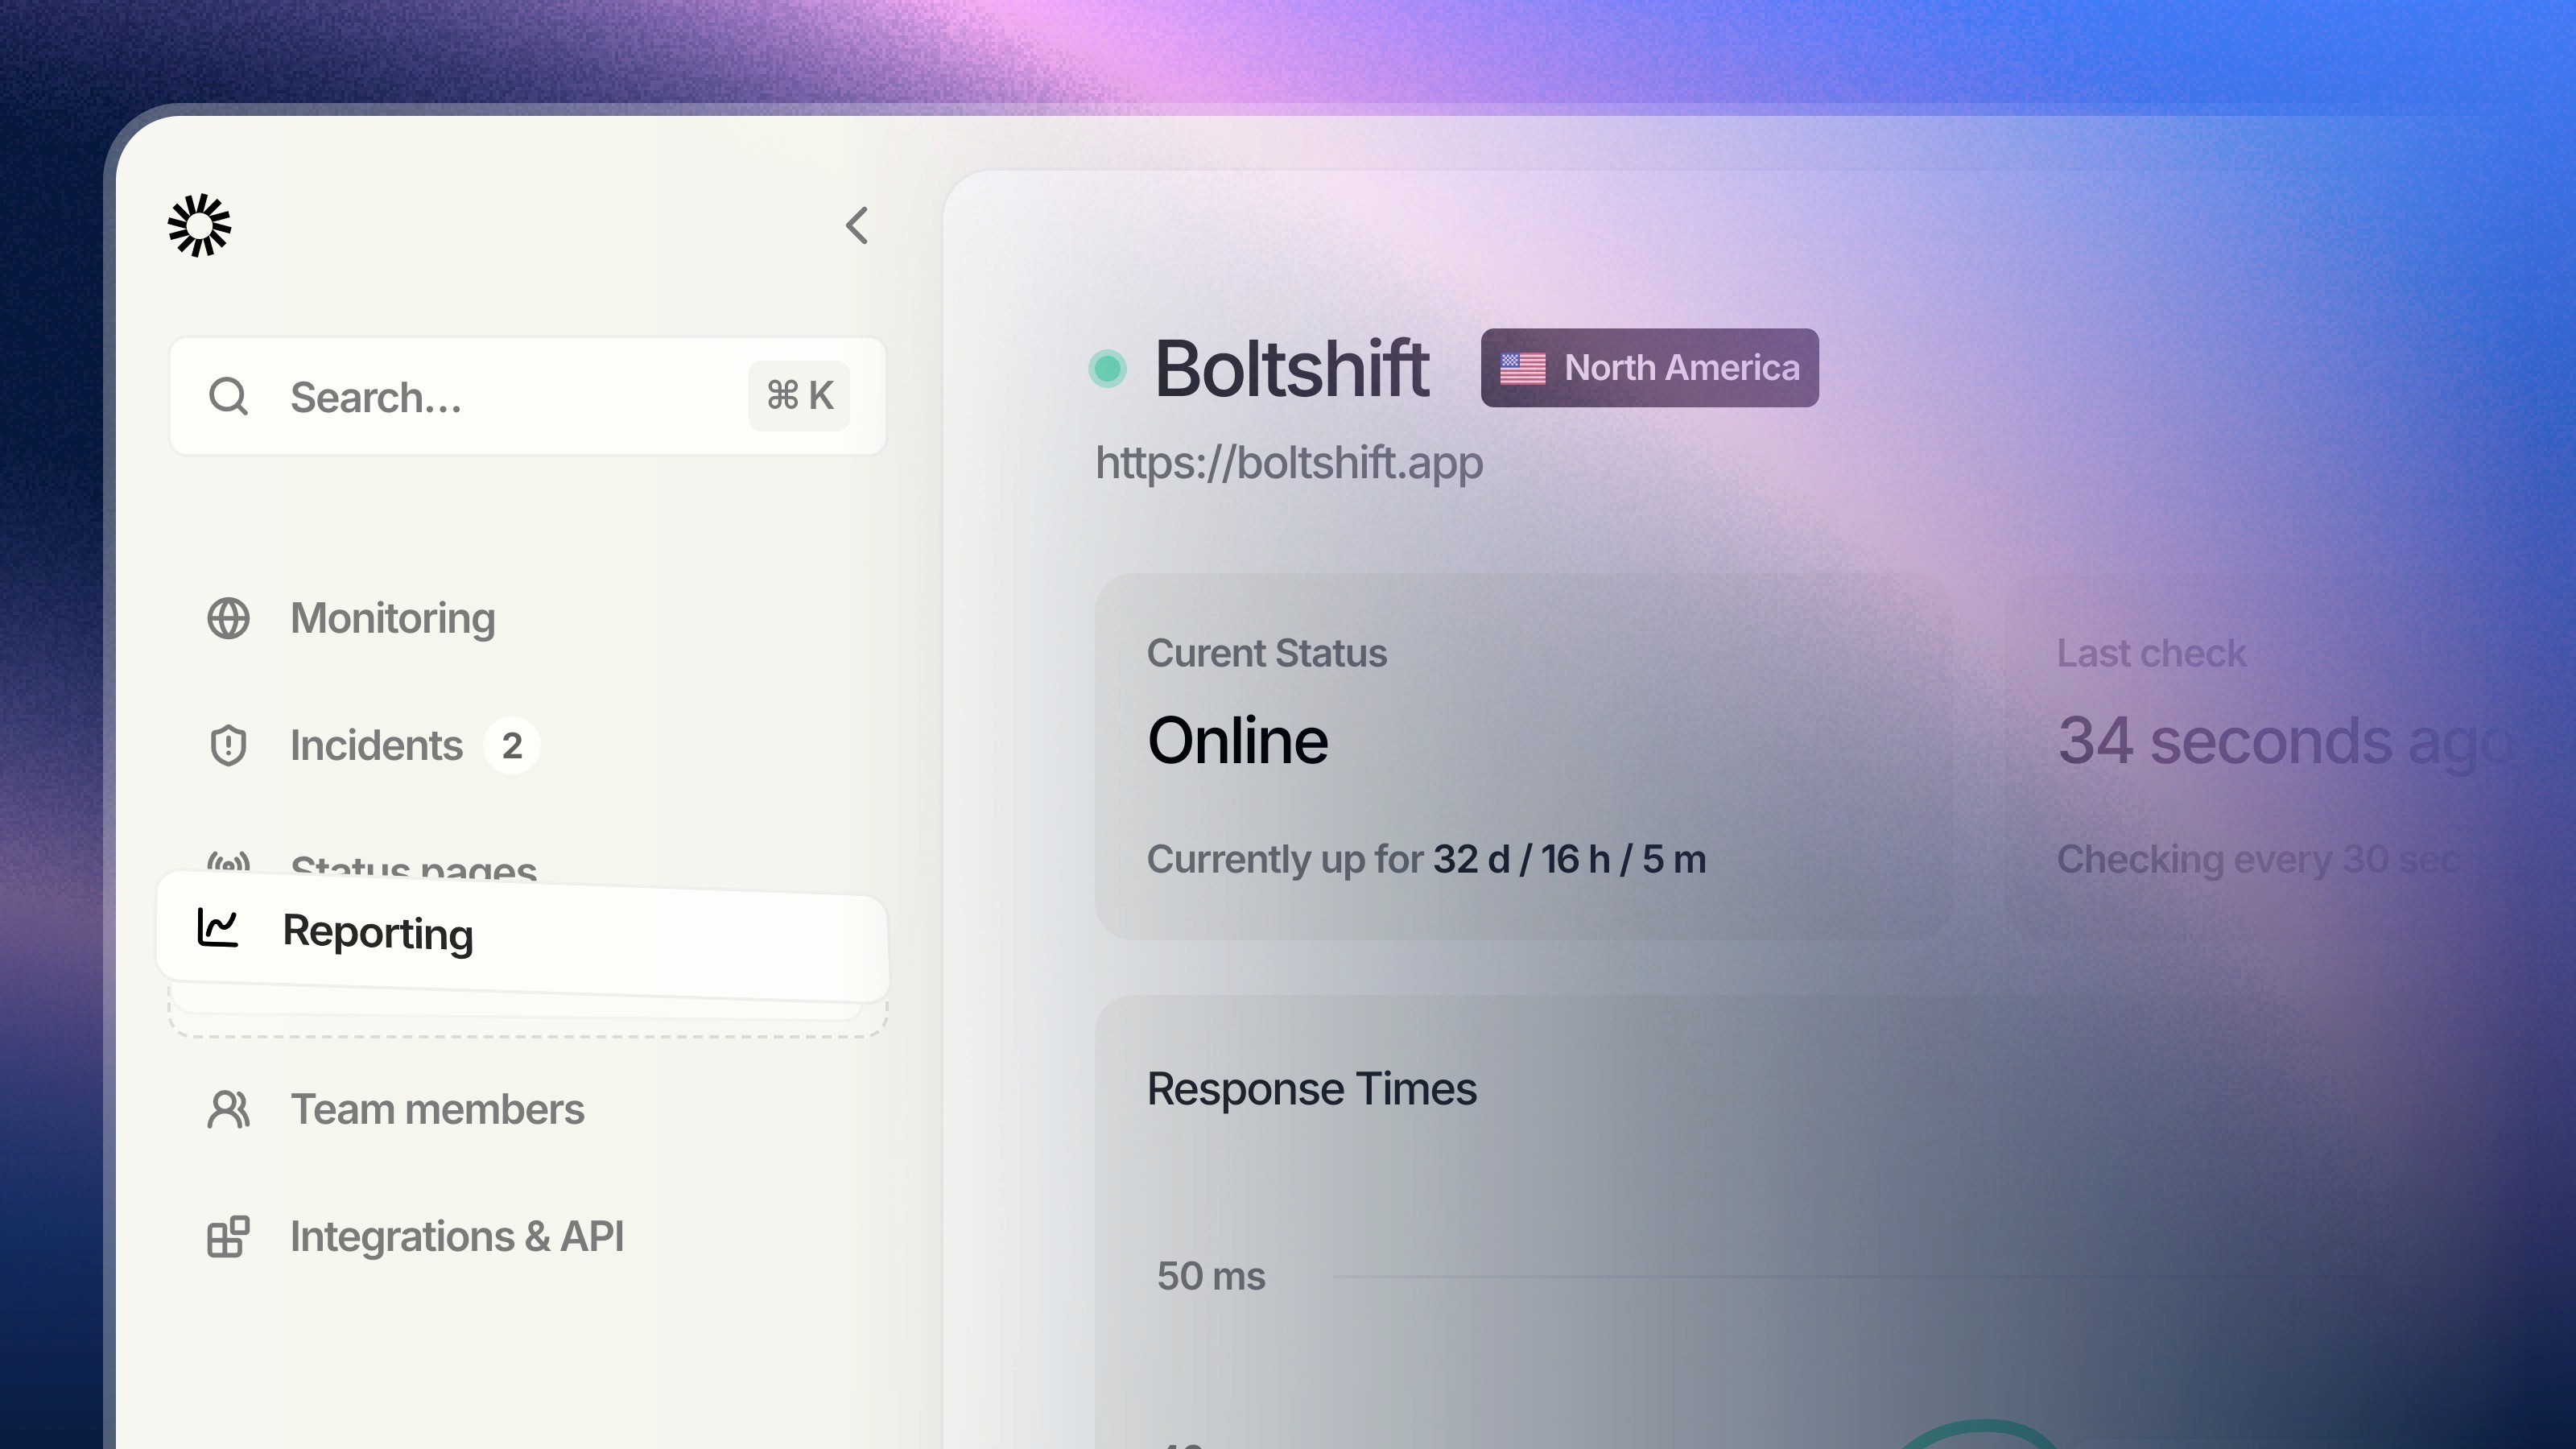
Understand your reliability at a glance. Set SLA targets per endpoint, track uptime trends, and export compliance reports — all from your Sola dashboard.

Added

  • SLA target configuration per endpoint (99.9%, 99.95%, 99.99%)

  • Incident impact reporting: total downtime, affected check count, and MTTR

  • Scheduled PDF and CSV report exports

  • Response time percentile breakdown (p50, p95, p99)

Improved

  • Monthly and rolling uptime calculations now available side-by-side

  • Uptime trend charts support custom time ranges up to 12 months

  • Team-level and service-level aggregated views for multi-team orgs

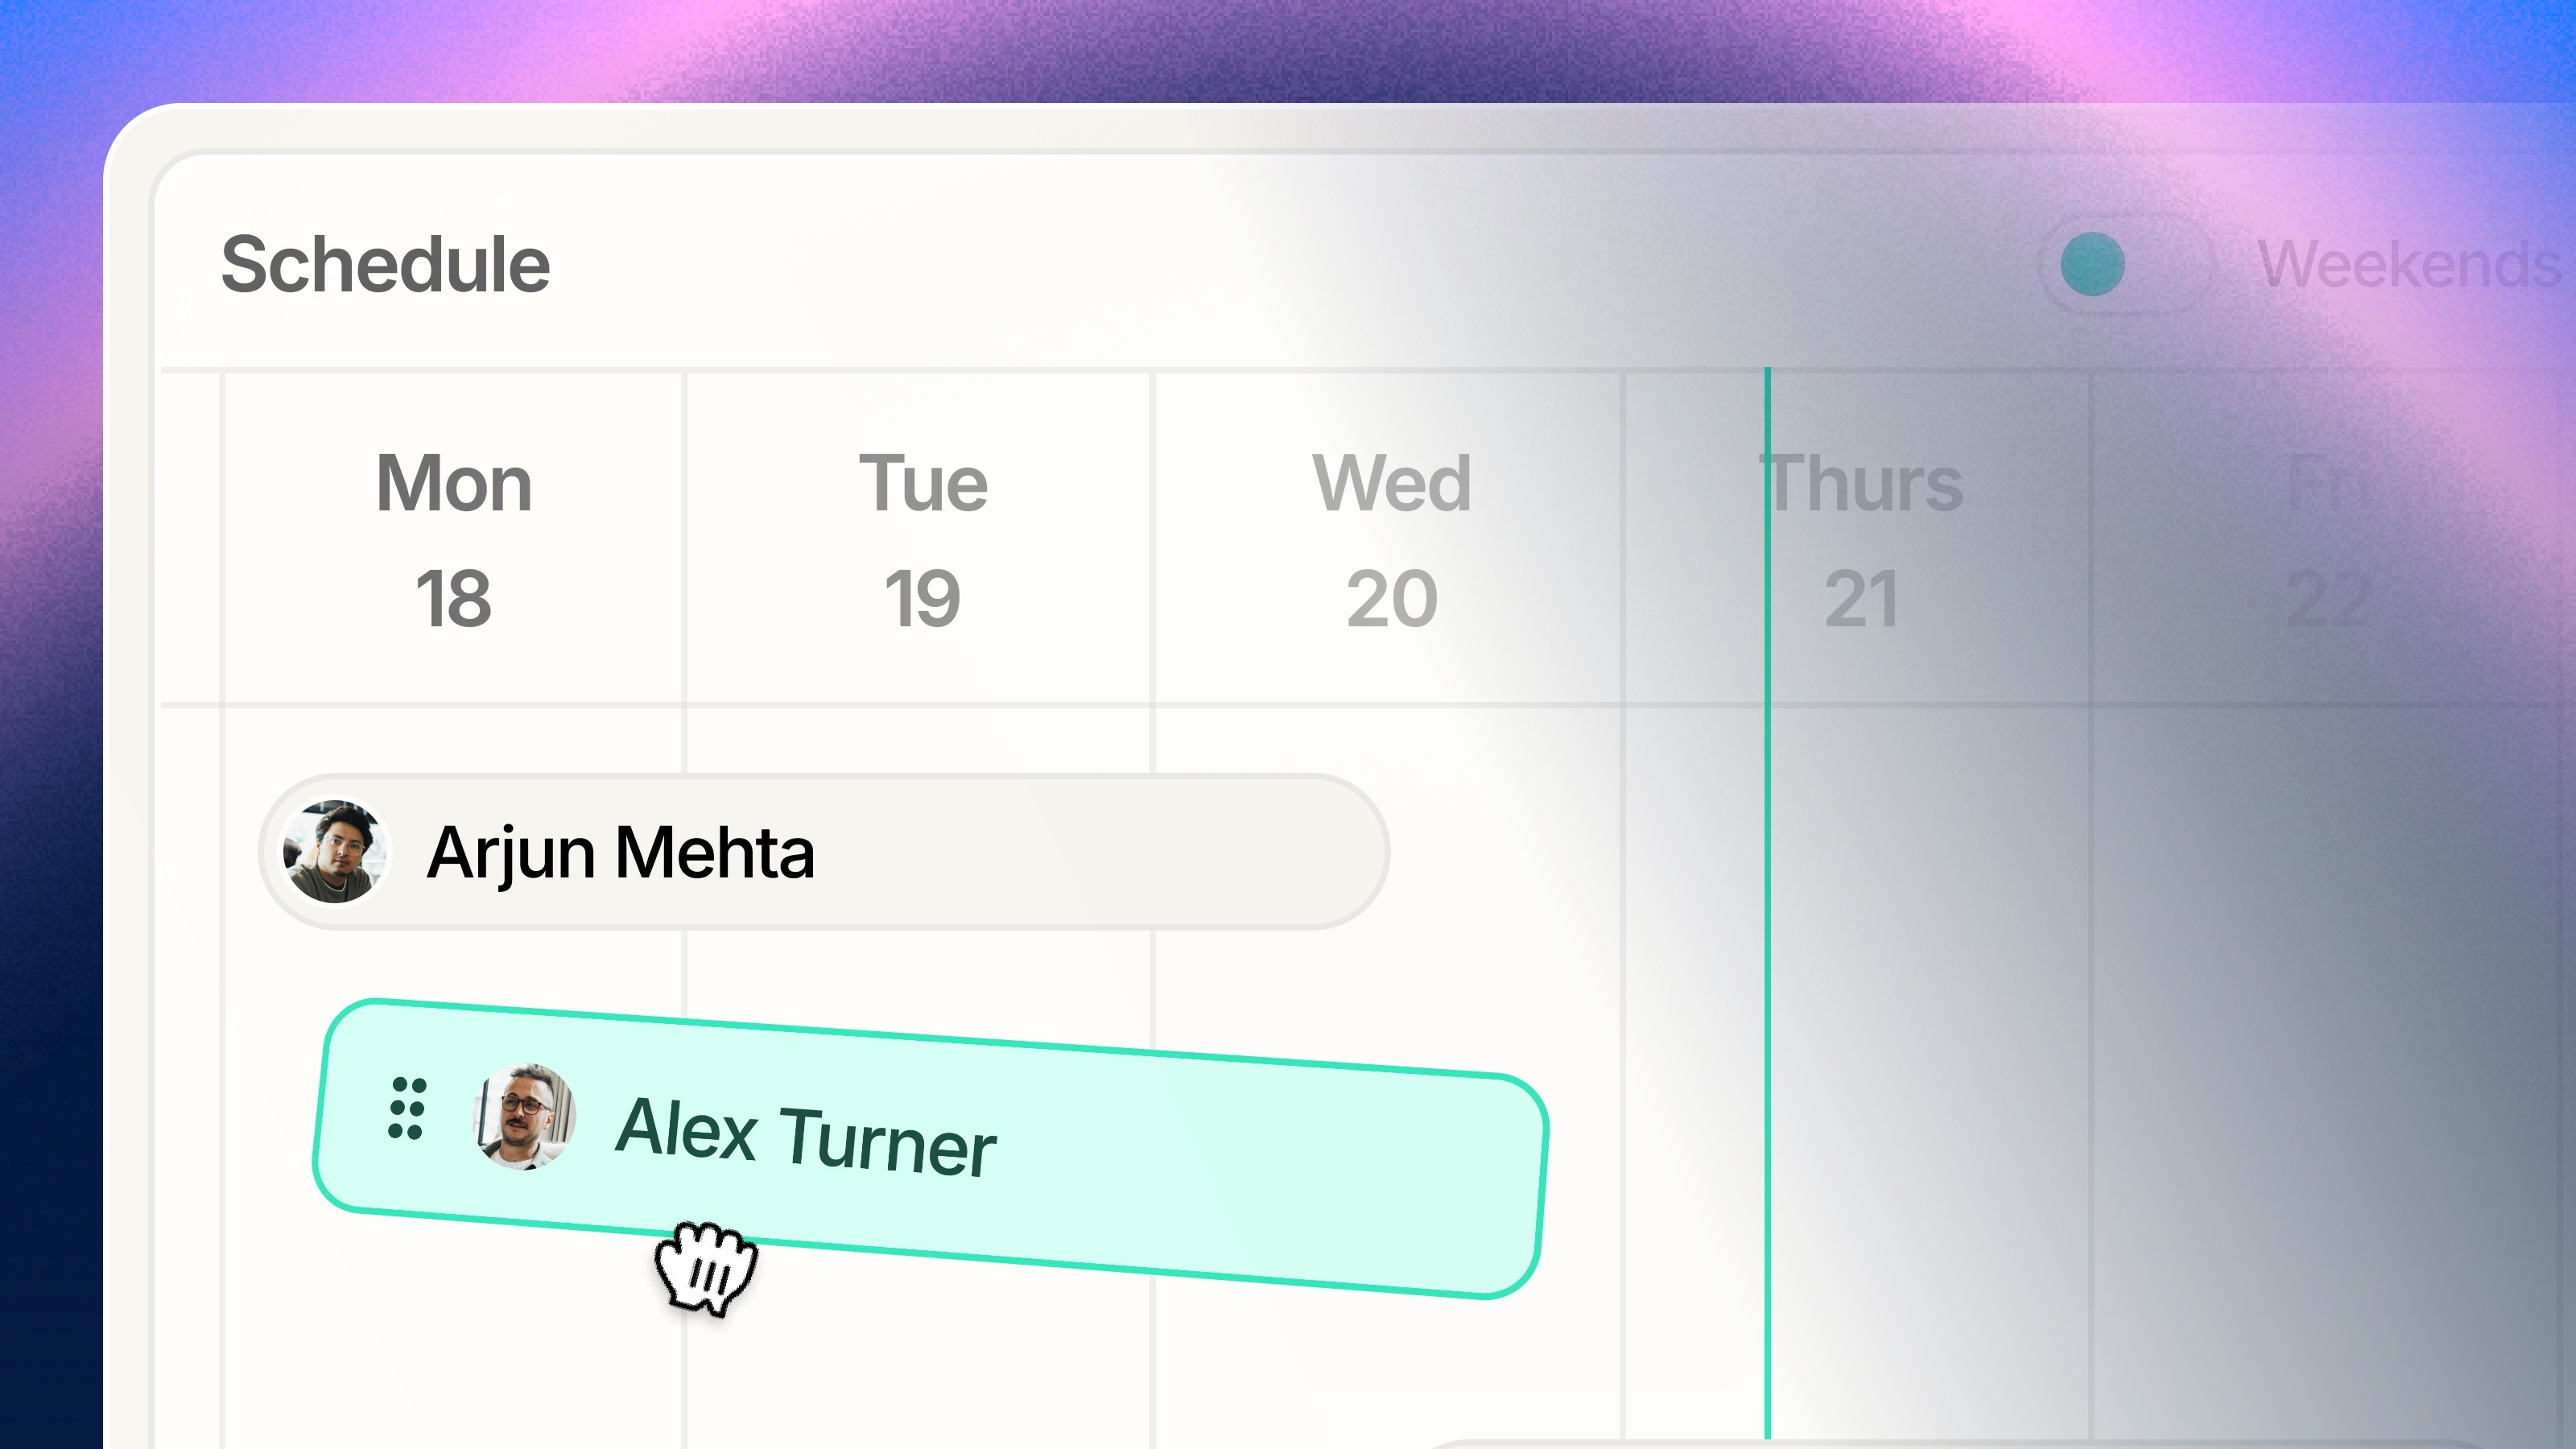
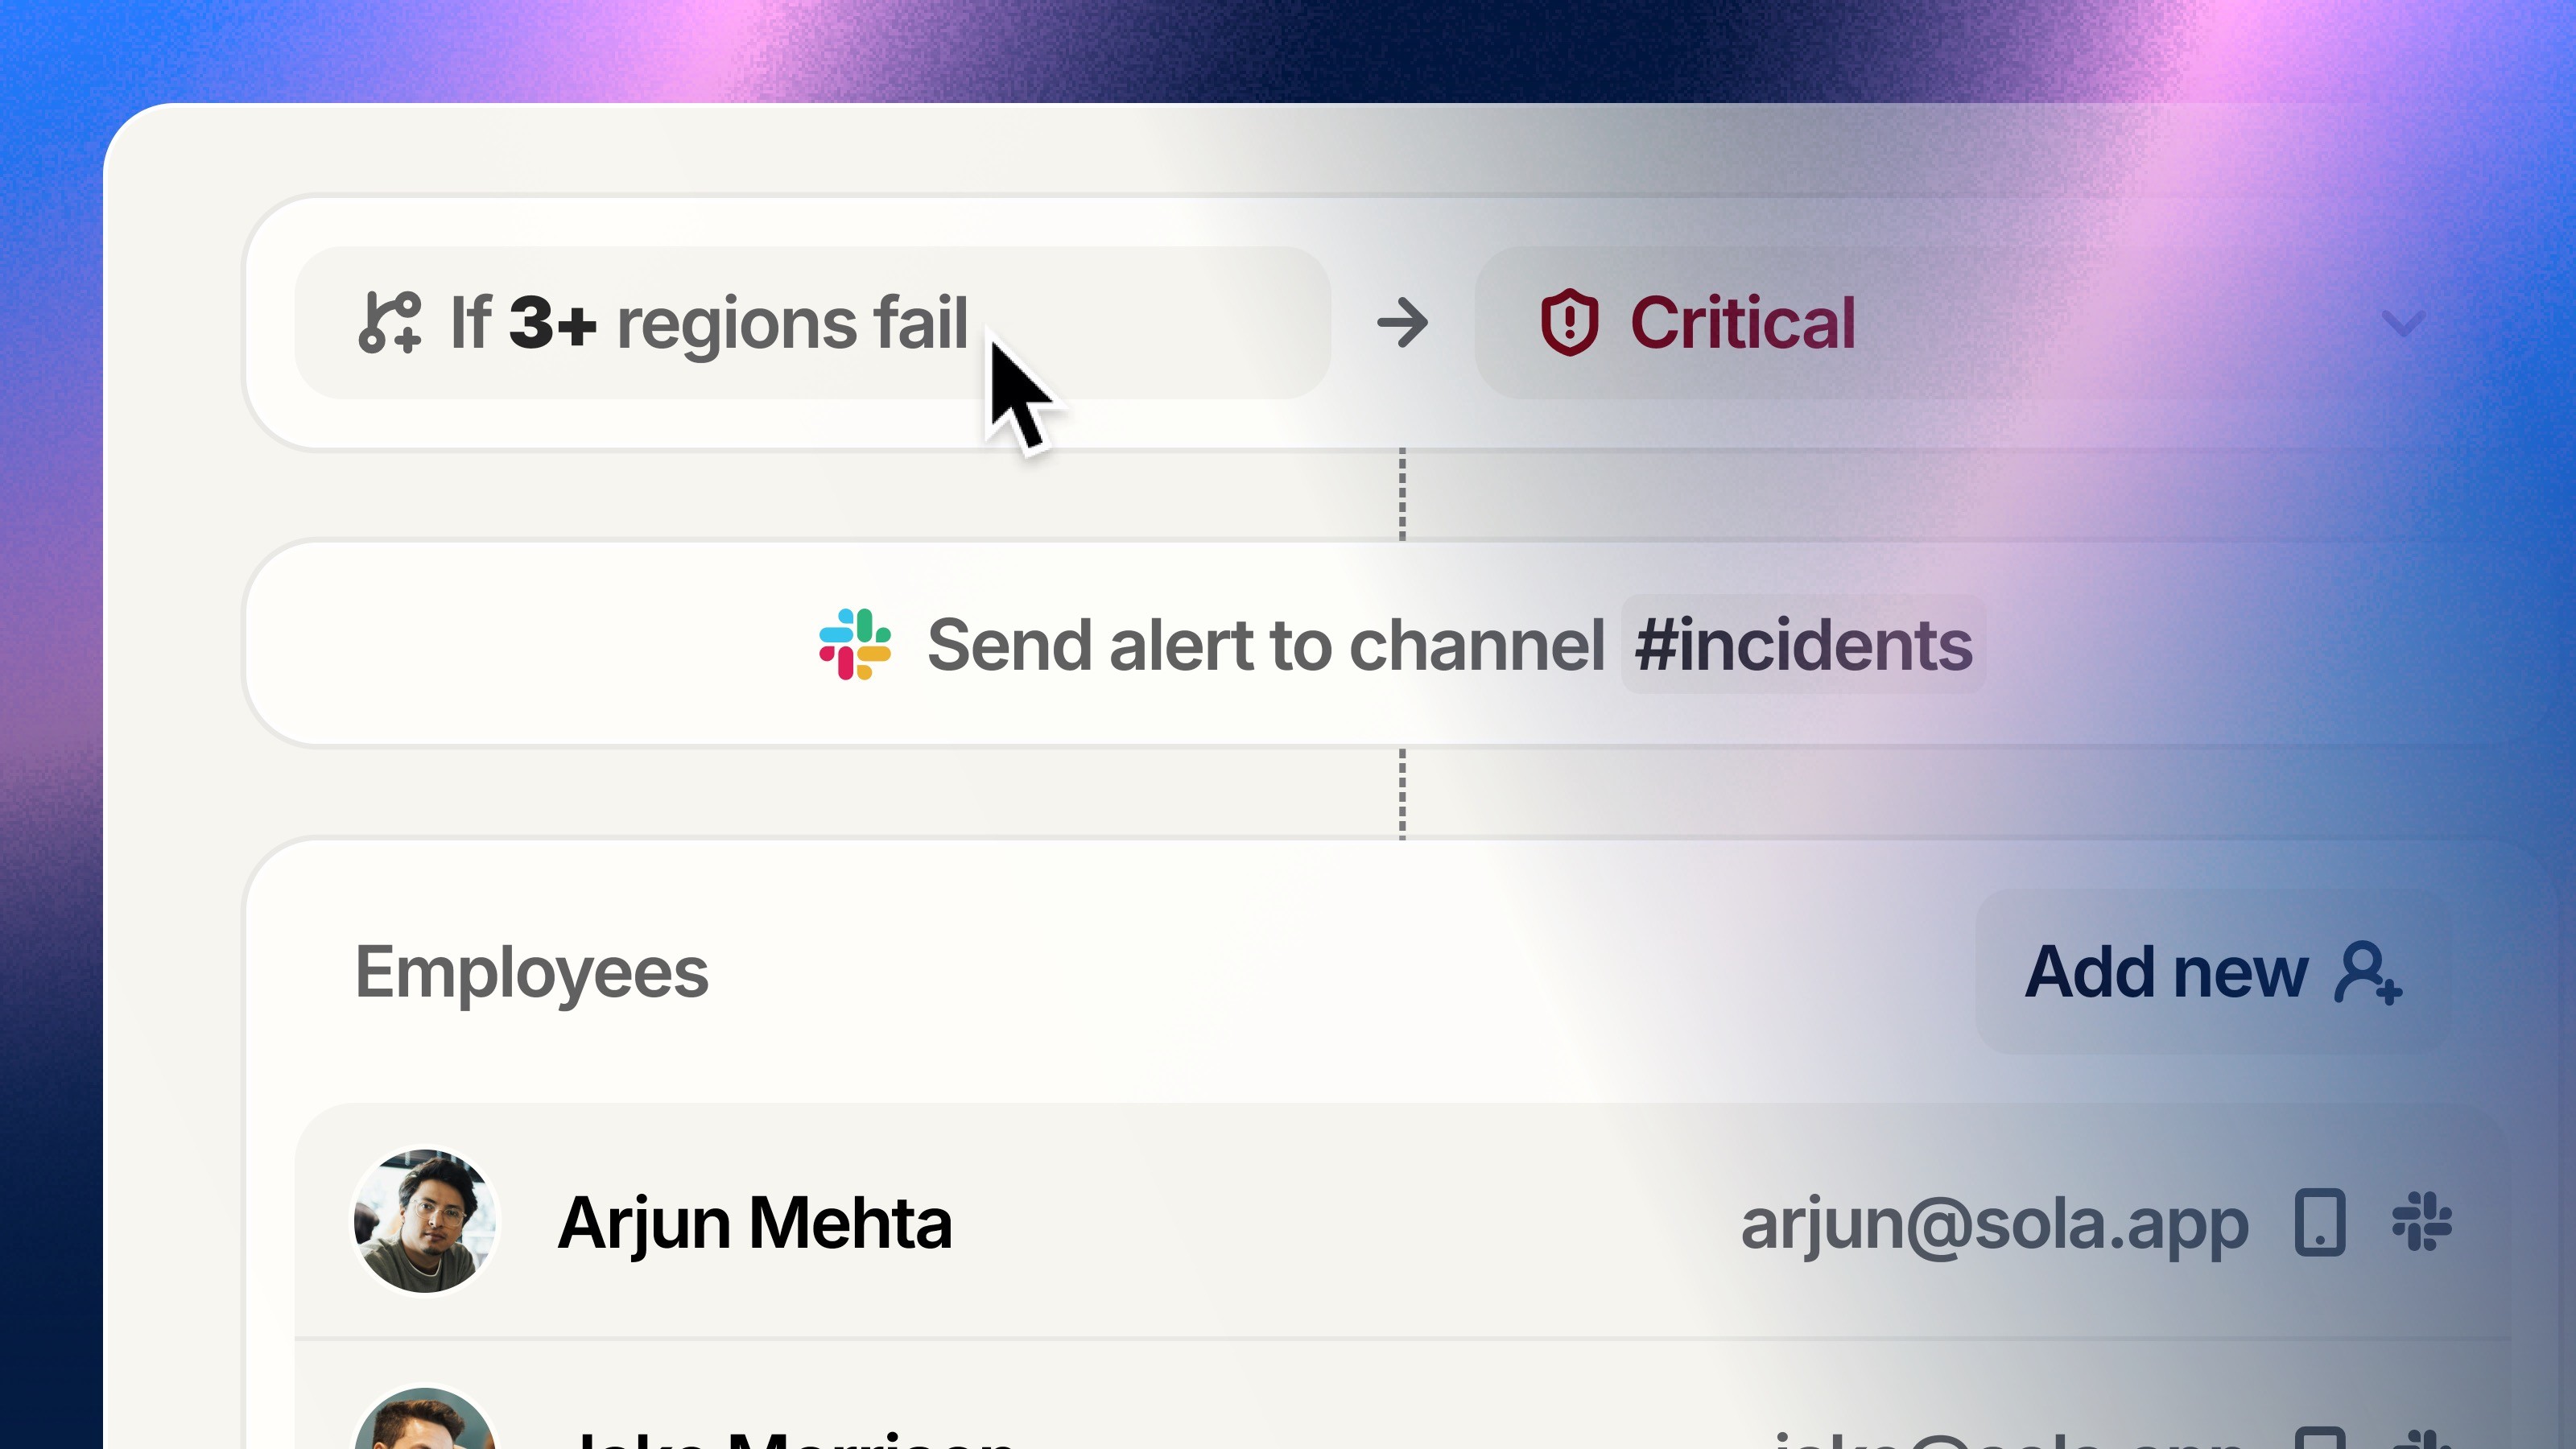
We've completely rebuilt alert routing from scratch. Define exactly who gets paged, under what conditions, and what happens if nobody responds — all without leaving Sola.

Added

  • Rule-based alert routing with priority ordering

  • Escalation policies with configurable acknowledgment windows

  • On-call scheduling with rotation and coverage gap detection

  • Quiet hours configuration per team member

  • Per-channel message templates for Slack, PagerDuty, email, SMS, and webhooks

Improved

  • Multi-condition rules now support region count, status code, response time, and time of day

  • Alert grouping suppresses duplicate notifications across overlapping rules

  • Routing rule editor redesigned for faster setup and easier testing